Note
Click here to download the full example code
Performing a Stress Analysis
Calculate and plot stresses on a section.
The following example demonstrates how a stress analysis can be performed on a cross-section. A 150x100x6 RHS is modelled on its side with a maximum mesh area of 2 mm2. The pre-requisite geometric and warping analyses are performed before two separate stress analyses are undertaken. The first combines bending and shear about the x-axis with a torsion moment and the second combines bending and shear about the y-axis with a torsion moment.
After the analysis is performed, various plots of the stresses are generated.
# sphinx_gallery_thumbnail_number = 1

import sectionproperties.pre.library.steel_sections as steel_sections
from sectionproperties.analysis.section import Section
Create a 150x100x6 RHS on its side
geometry = steel_sections.rectangular_hollow_section(d=100, b=150, t=6, r_out=15, n_r=8)
Create a mesh and section object. For the mesh, use a maximum area of 2
geometry.create_mesh(mesh_sizes=[2])
section = Section(geometry)
Perform a geometry and warping analysis
section.calculate_geometric_properties()
section.calculate_warping_properties()
Perform a stress analysis with Mx = 5 kN.m; Vx = 10 kN and Mzz = 3 kN.m
case1 = section.calculate_stress(Mxx=5e6, Vx=10e3, Mzz=3e6)
Perform a stress analysis with My = 15 kN.m; Vy = 30 kN and Mzz = 1.5 kN.m
case2 = section.calculate_stress(Myy=15e6, Vy=30e3, Mzz=1.5e6)
Plot the bending stress for case1
case1.plot_stress_m_zz(pause=False)
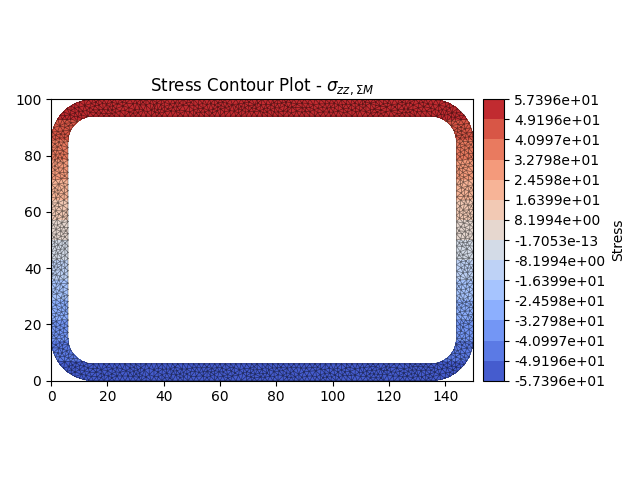
<AxesSubplot: title={'center': 'Stress Contour Plot - $\\sigma_{zz,\\Sigma M}$'}>
Plot the torsion vectors for case1
case1.plot_vector_mzz_zxy(pause=False)

<AxesSubplot: title={'center': 'Stress Vector Plot - $\\sigma_{zxy,Mzz}$'}>
Plot the shear stress for case2
case2.plot_stress_v_zxy(pause=False)
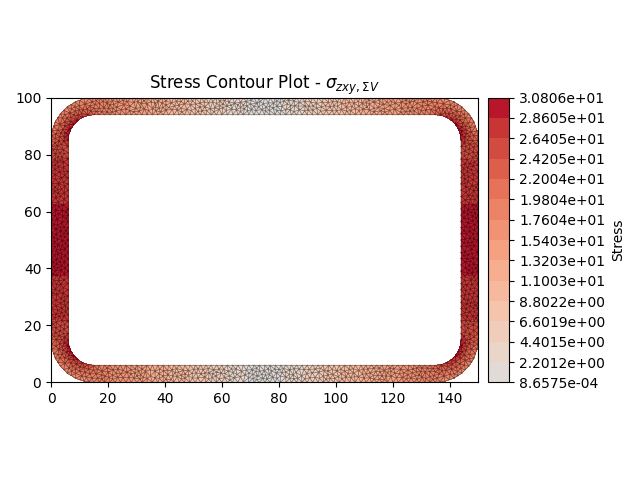
<AxesSubplot: title={'center': 'Stress Contour Plot - $\\sigma_{zxy,\\Sigma V}$'}>
Plot the von mises stress for case1
case1.plot_stress_vm(pause=False)
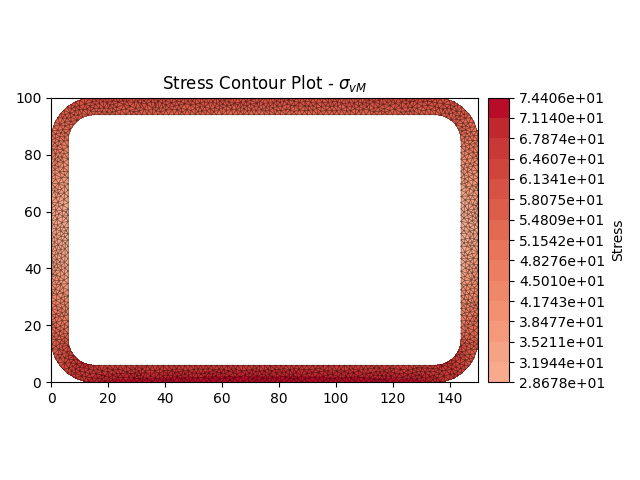
<AxesSubplot: title={'center': 'Stress Contour Plot - $\\sigma_{vM}$'}>
Plot the von mises stress for case2
case2.plot_stress_vm()
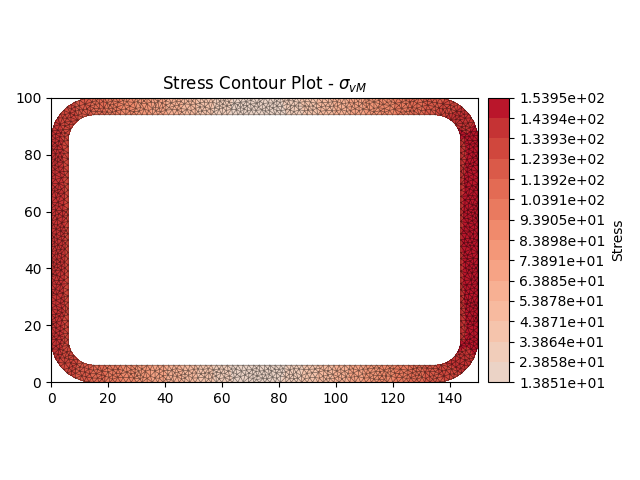
<AxesSubplot: title={'center': 'Stress Contour Plot - $\\sigma_{vM}$'}>
Total running time of the script: ( 0 minutes 26.155 seconds)